
Applications · System packages
From hardware to a clear site workflow
A practical layer between WSmart’s capabilities and how your site runs. Start with a system package, then shape devices, connectivity, dashboard and workflow around the site.
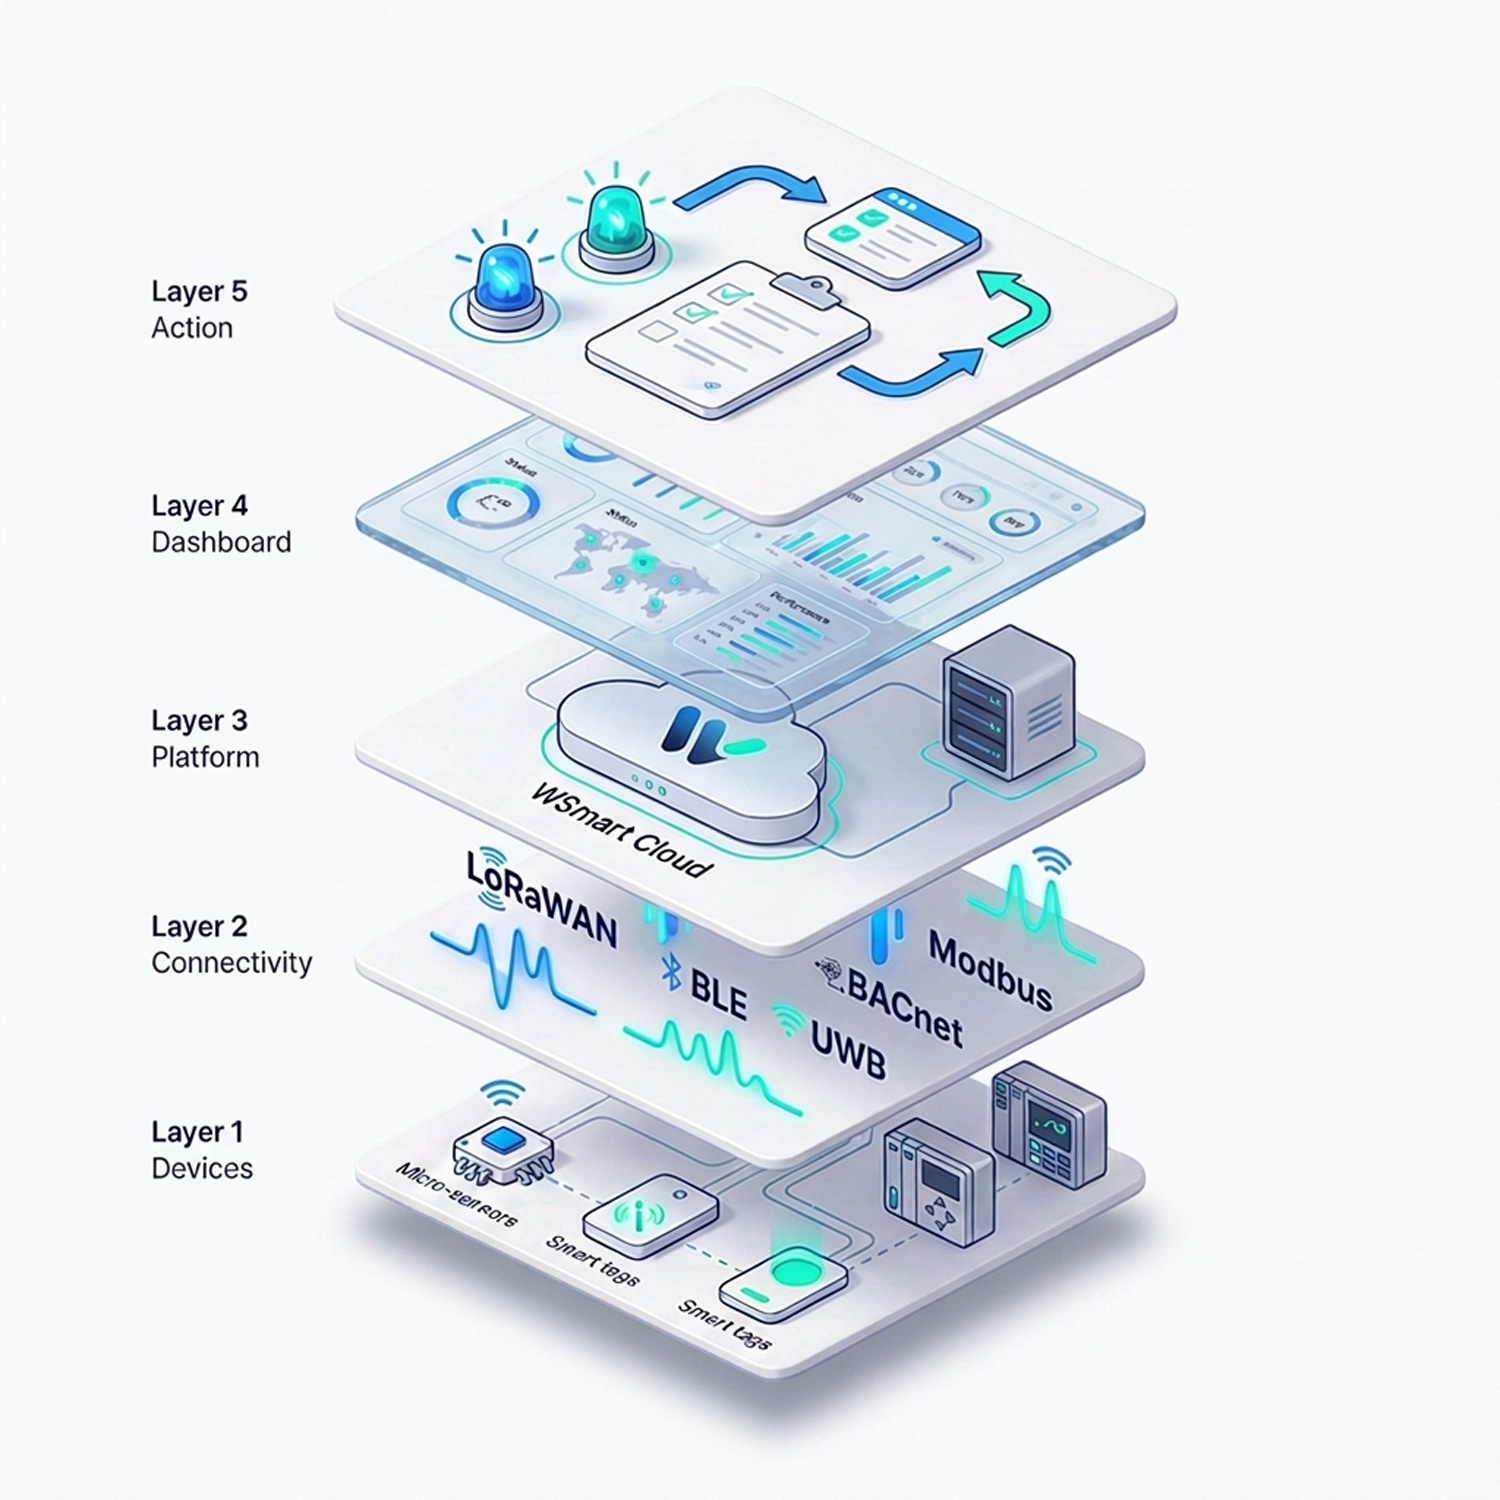
How applications are built
One operating model — many site-specific builds
Every application follows the same logic: sense what matters, move the data, show it, route an alert and record the response.
Devices
Sensors, meters, tags and controllers
Connectivity
LoRaWAN, BLE, UWB, BACnet, Modbus or edge links
Platform
WSmart cloud or on-premises data layer
Dashboard
Status, trends, reports and maps
Action
Alerts, app tasks, control and audit trail
Application catalogue
Start with a proven pattern
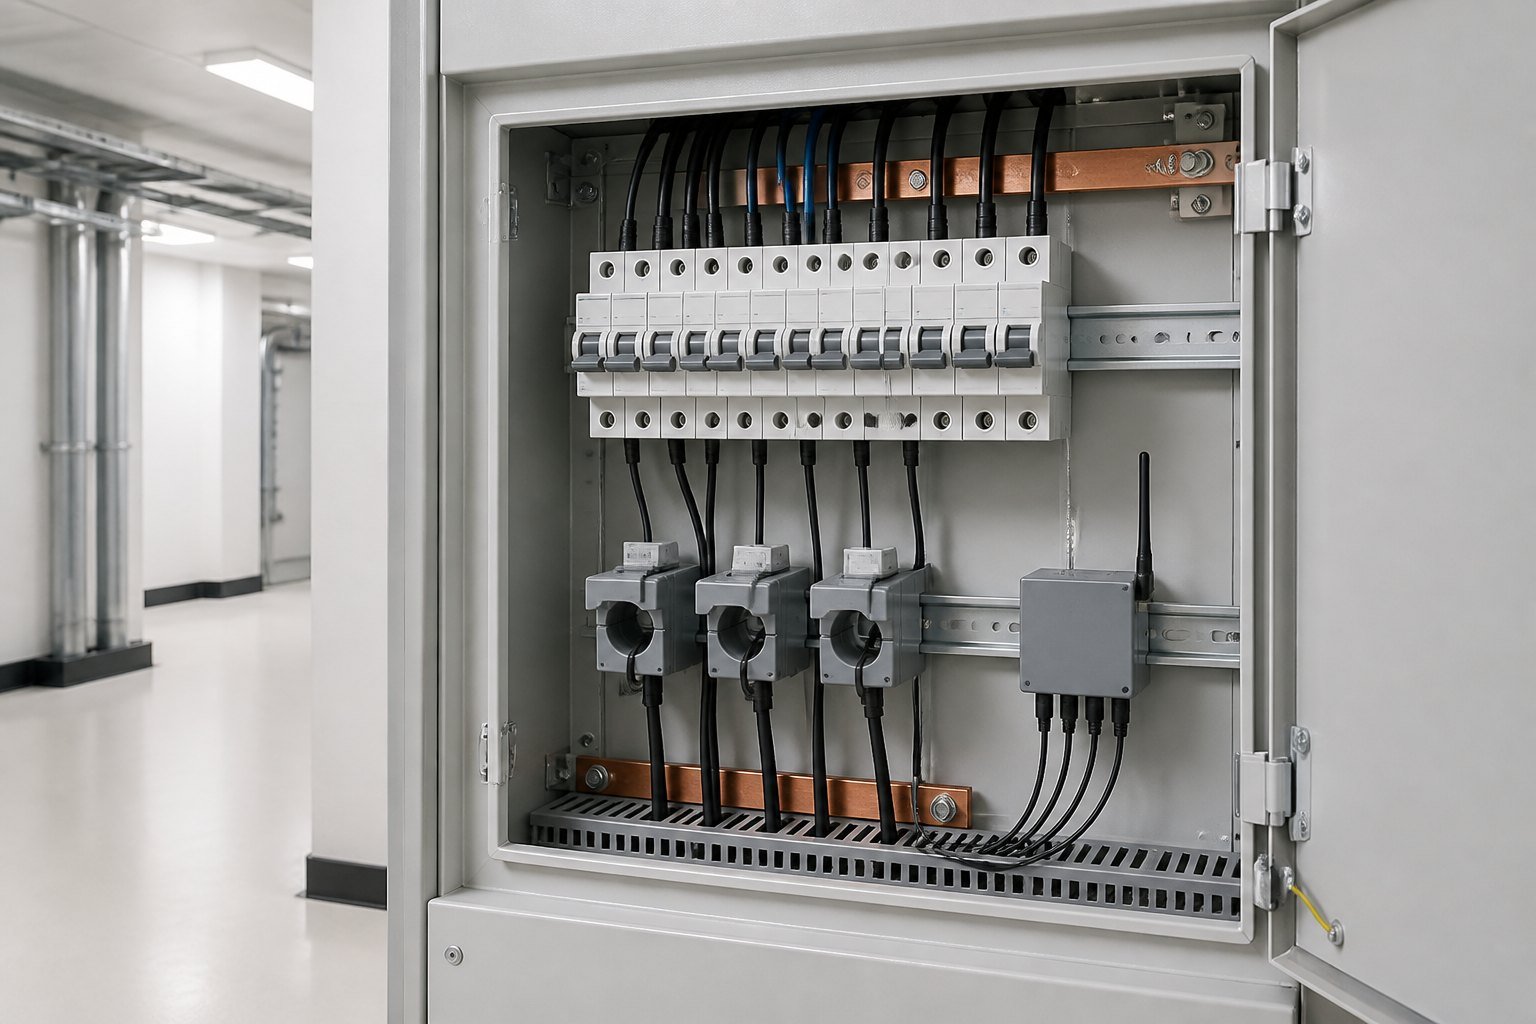
BMS retrofit
Add LoRaWAN temperature, humidity, leak, power and dry-contact sensing to existing BACnet or Modbus systems. Dashboard: equipment status, floor views, alarms, scheduling and energy trends.
Hardware: sensors · meters · Bridge IO · gateways
Explore BMS retrofit →
LoRaWAN staff safety monitoring
Combine GNSS, BLE, UWB and LoRaWAN devices for location, SOS, vital status and incident monitoring in factories, logistics sites and remote work zones.
Dashboard: last location · zones · SOS · battery · event timeline
Explore staff safety →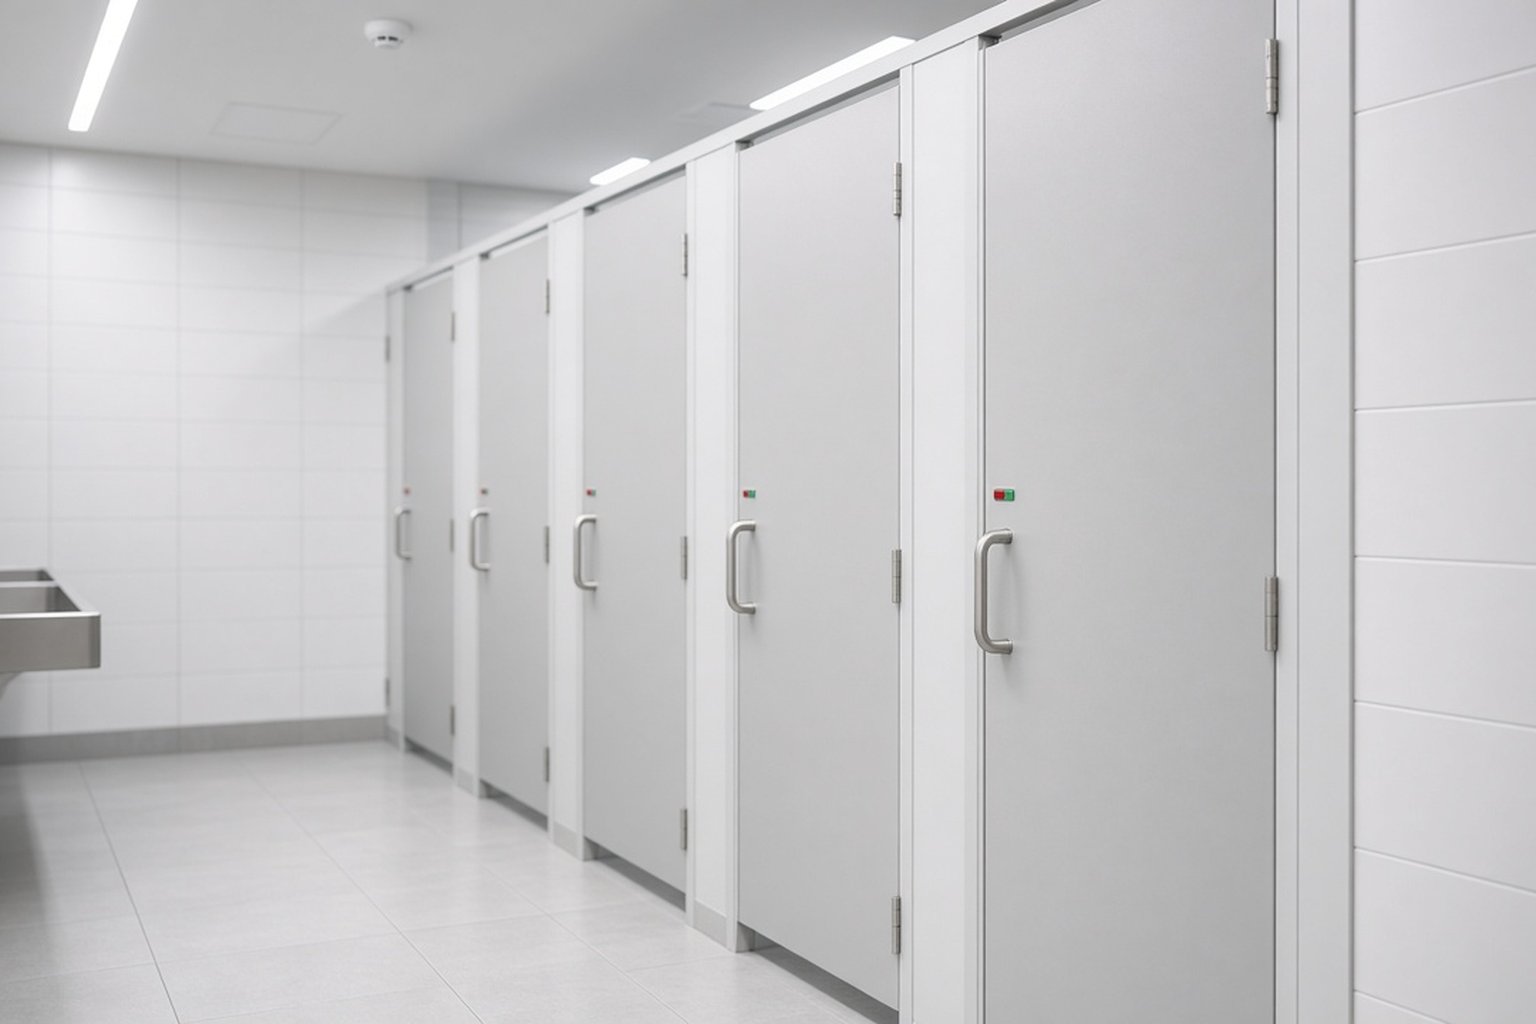
Toilet occupancy
Monitor room occupancy, usage patterns and service demand with door, PIR or mmWave sensors. Route cleaning tasks using occupancy history rather than fixed rounds alone.
Dashboard: live occupancy · peak periods · long dwell · service status
Explore toilet occupancy →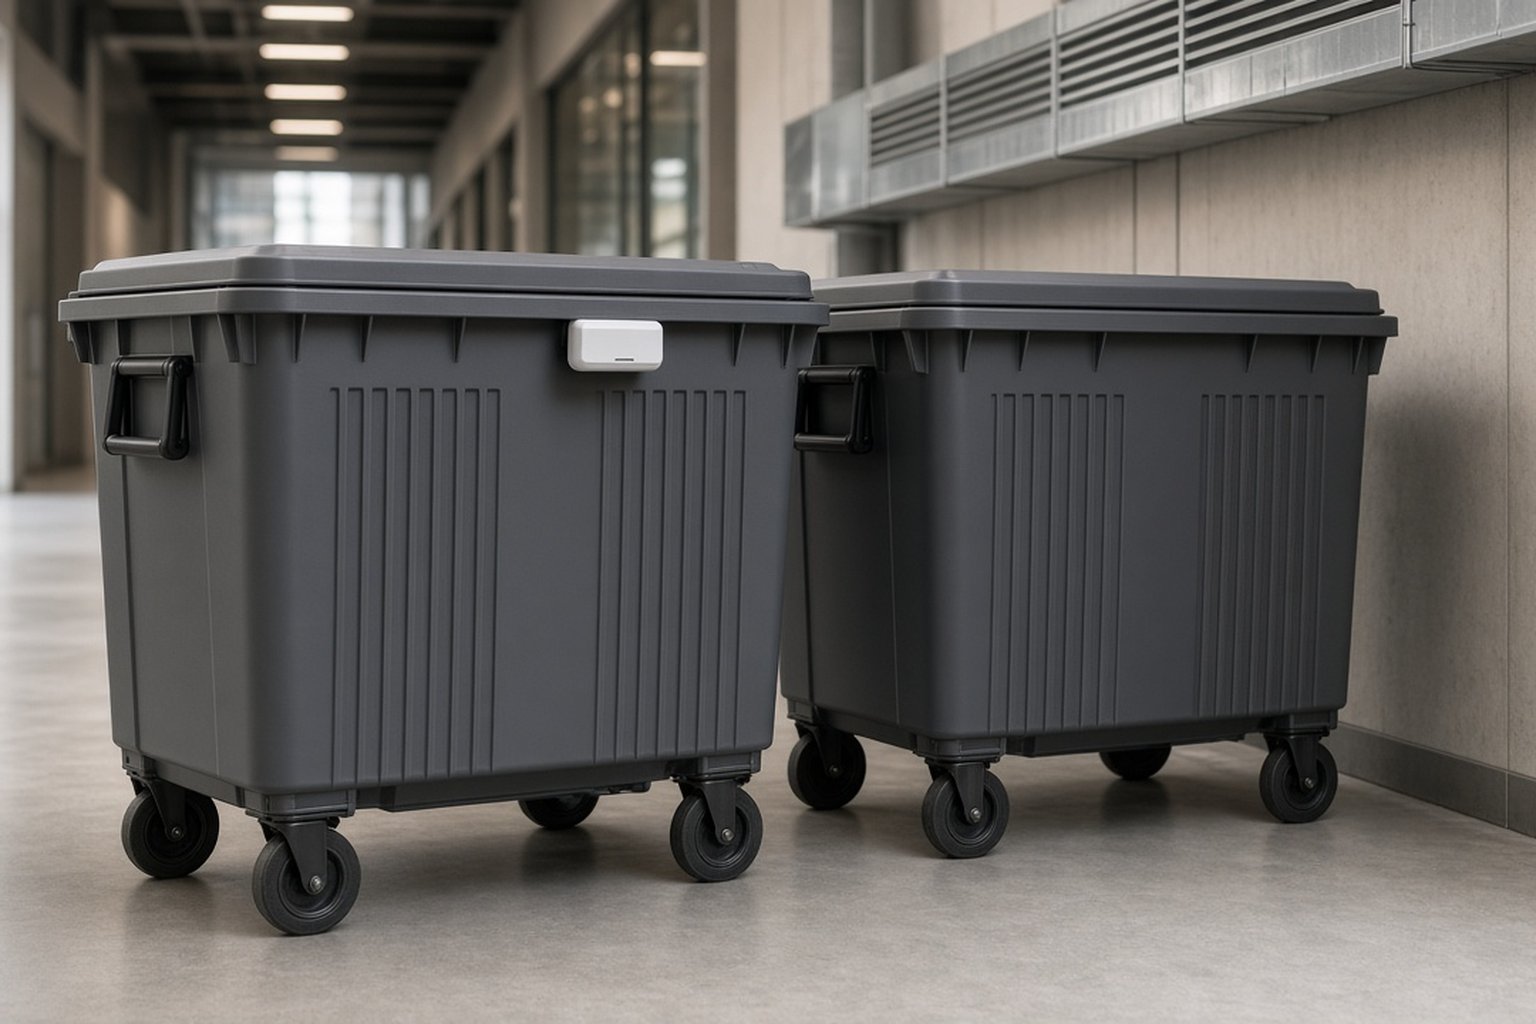
Rubbish bin monitoring
Use fill-level, weight, temperature or tilt sensing to prioritise collection, reduce overflow and build a measurable cleaning route across malls, campuses and estates.
Dashboard: fill level · temperature · tilt · route · collection log
Explore bin monitoring →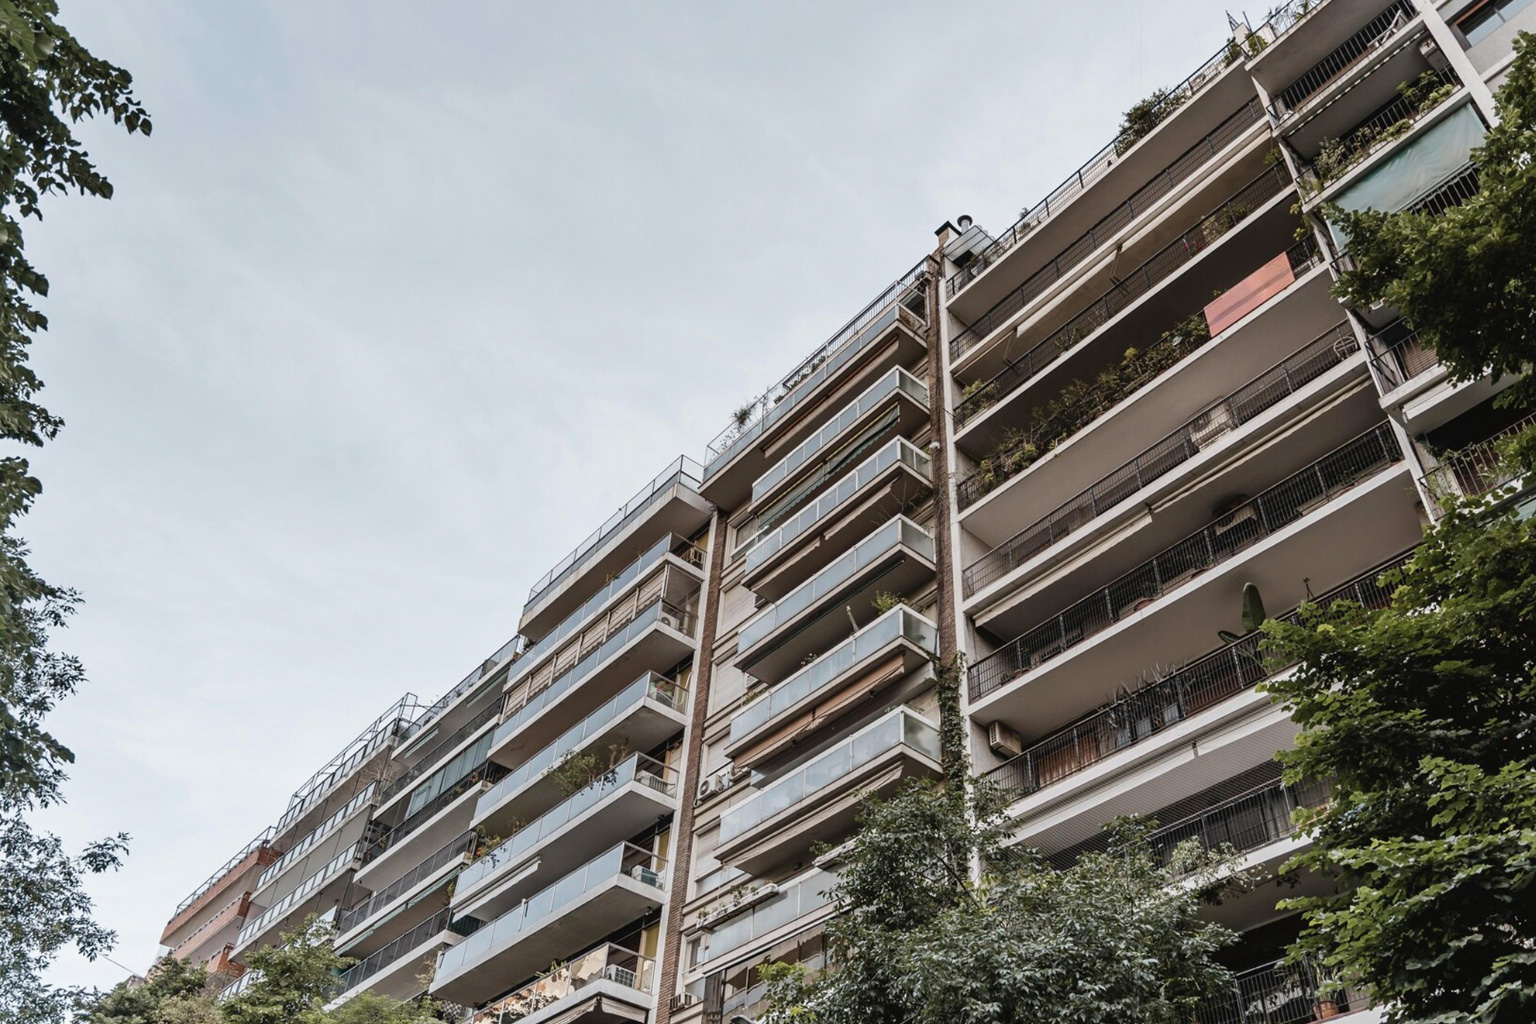
General property monitoring
Bring leakage, IAQ, temperature, humidity, noise, power, water and vibration into one property view, with sensor health, trends and maintenance actions.
Dashboard: site map · alarms · trends · consumption · work status
Explore property monitoring →
Elderly care total solution
UWB and BLE infrastructure for indoor positioning, fall detection, call bell, anti-wandering, wetness alerts, vital signs and closed-loop care workflows.
Explore the care solution →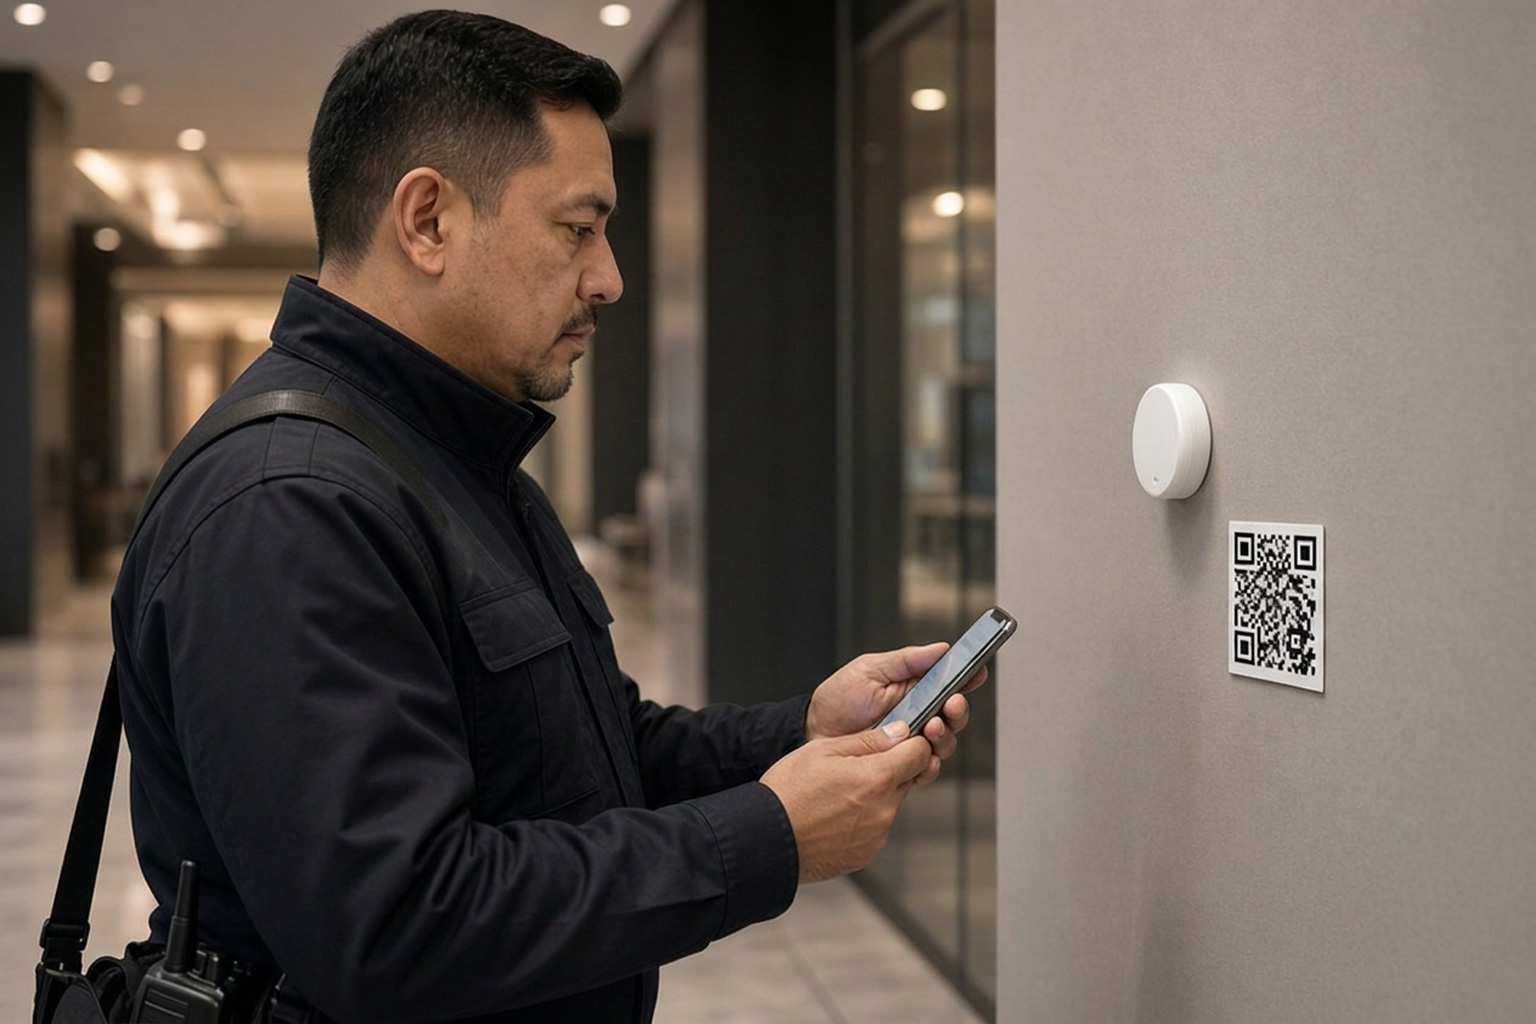
Proactive patrol and response
Verify staff attendance with the mobile app, iBeacon and QR codes. Alerts, patrol tasks and audit records close in one loop.
Explore patrol →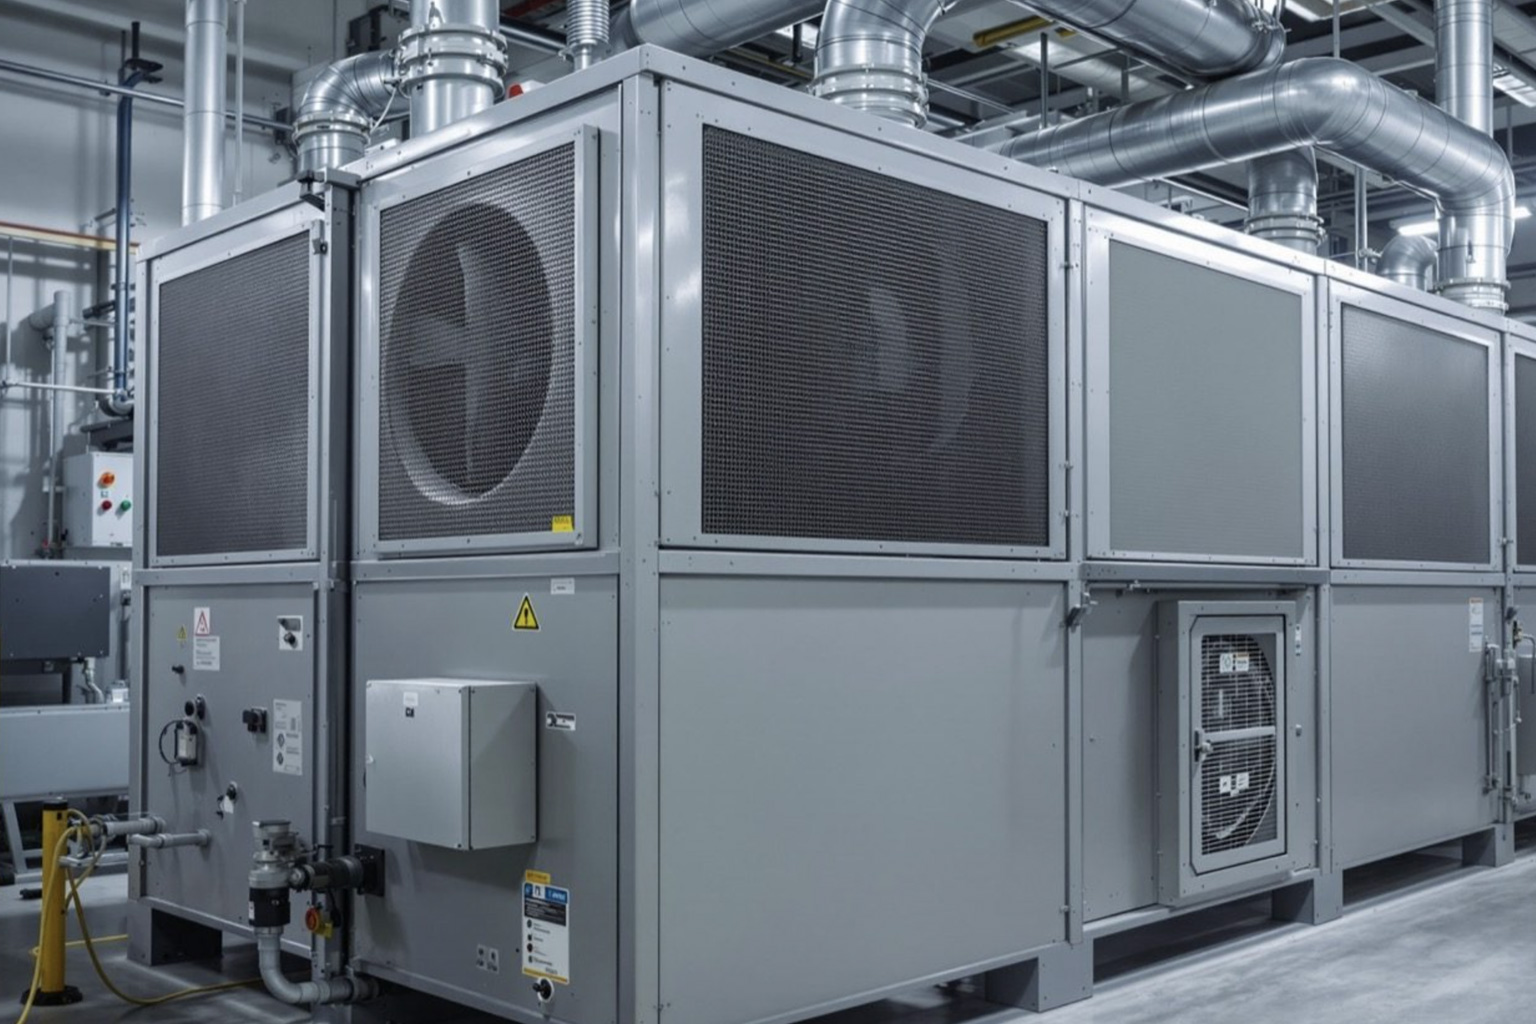
Energy Saving Solution (DCD)
Give data centres HVAC energy views, remote control, equipment status and multi-site reporting.
View related proof →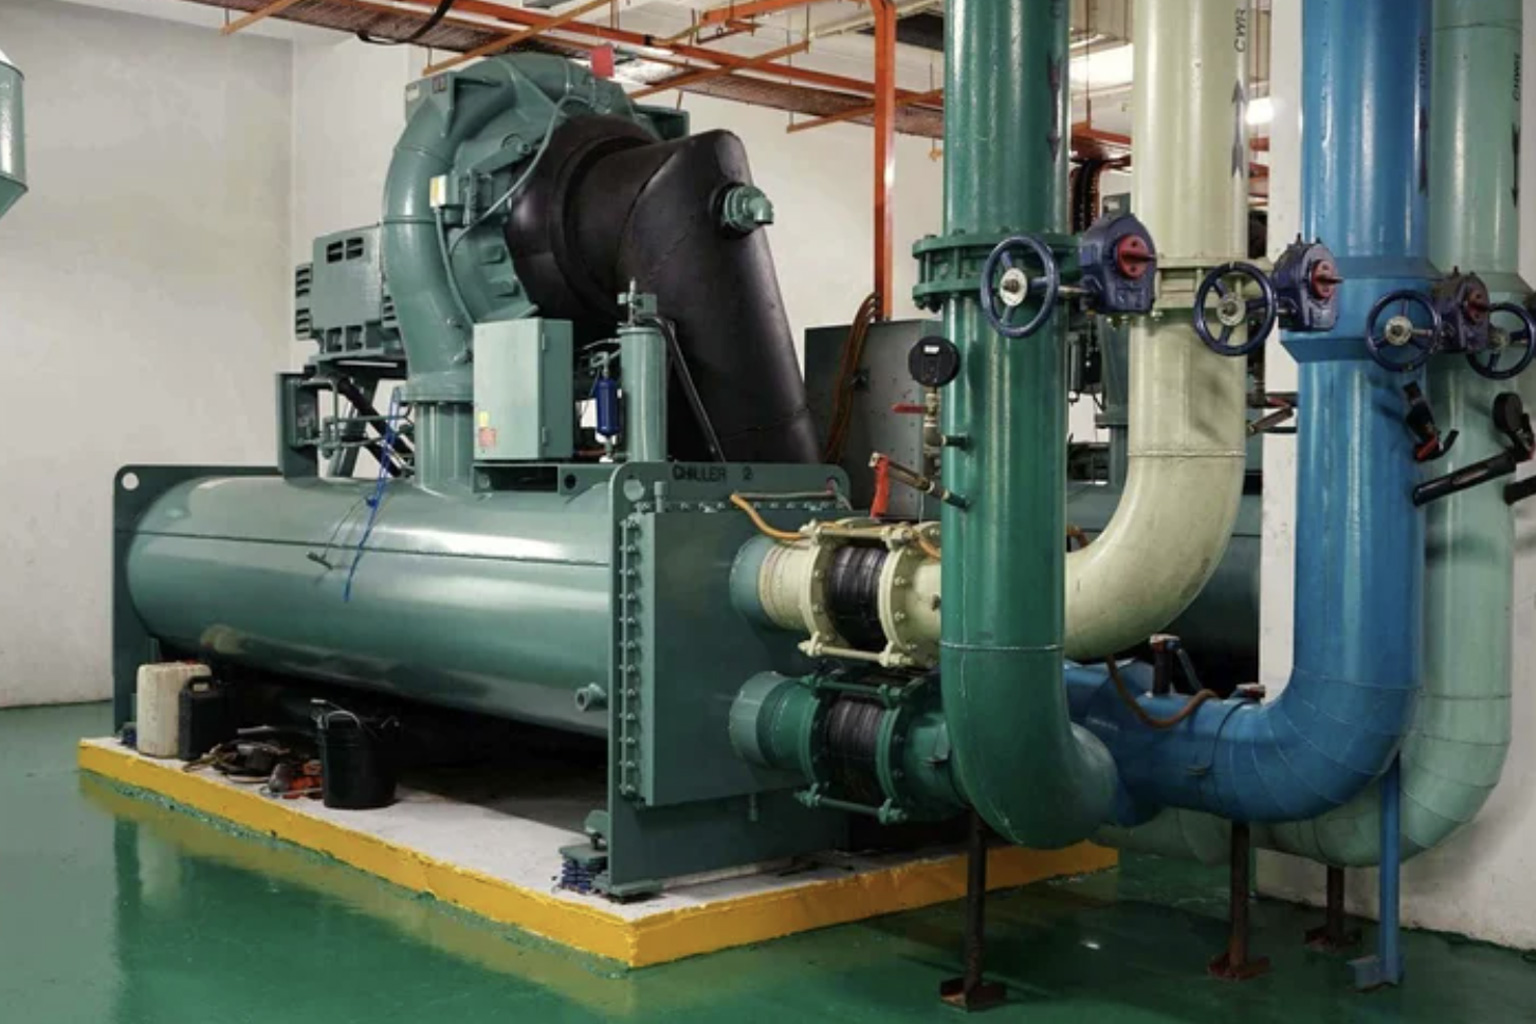
Chiller monitoring
Bring chiller performance, COP, temperatures and water-treatment data into one dashboard so issues show up earlier and maintenance decisions are clearer.
View related proof →Proof in operation
The same application layer, proven on live sites
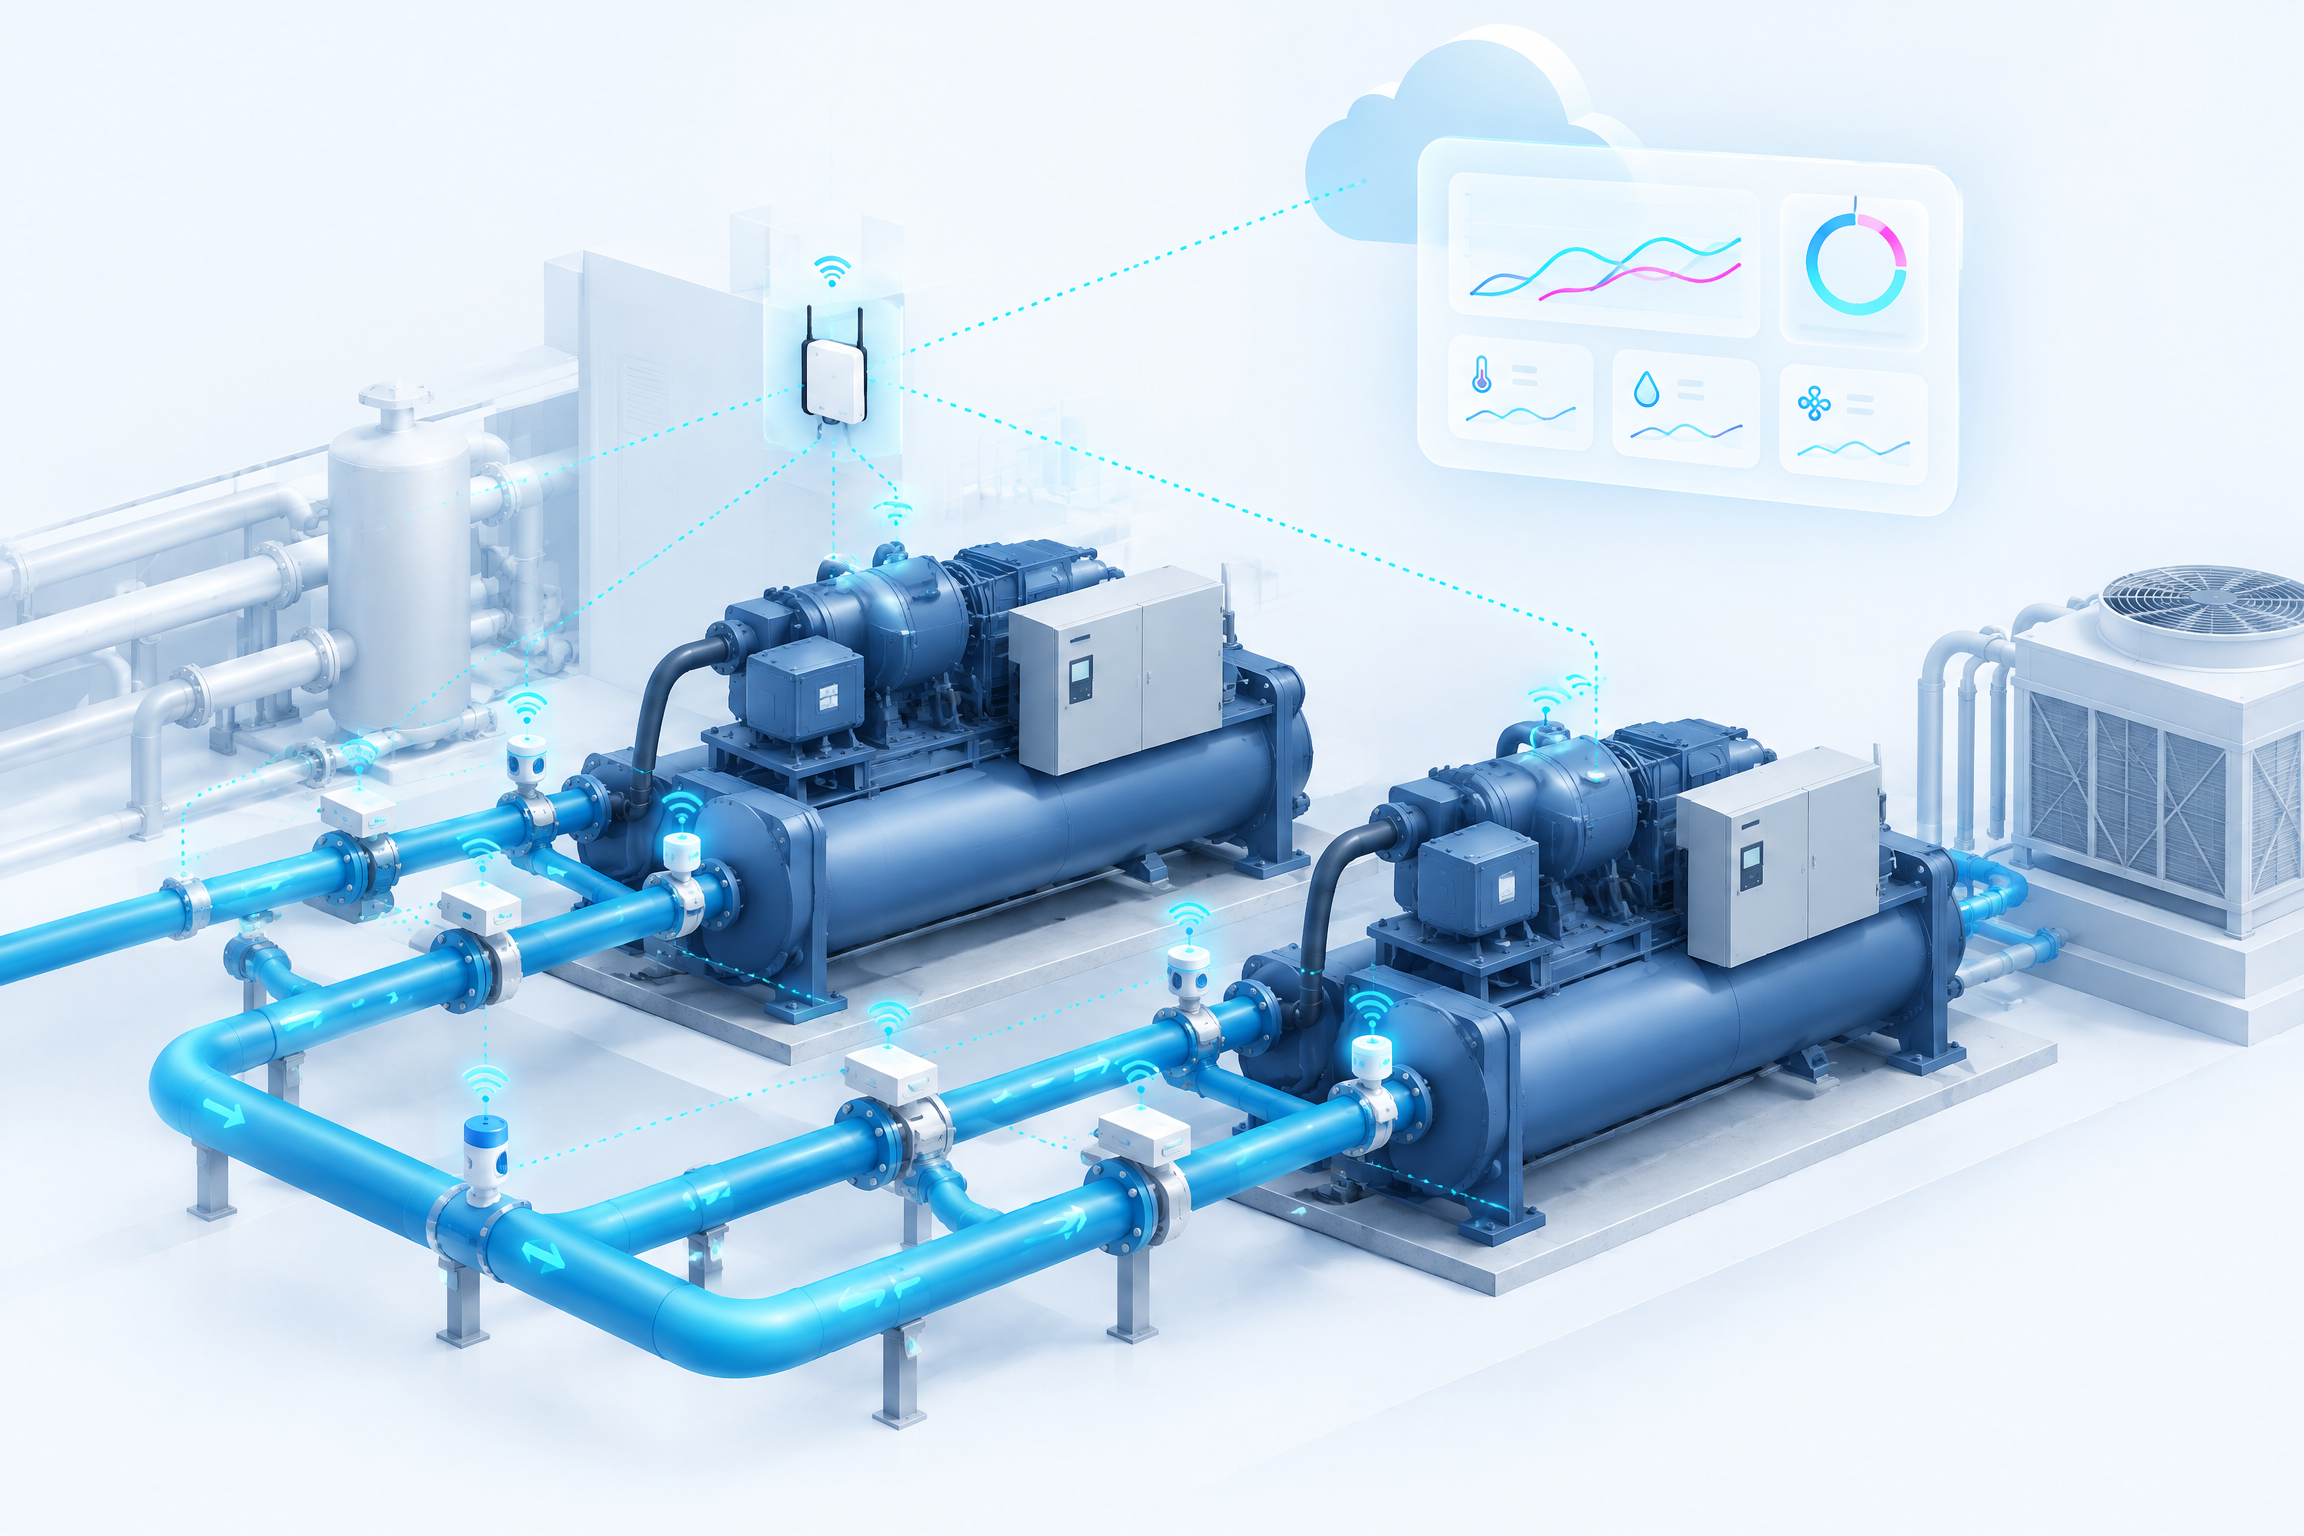
Newton Technology Group
Chiller monitoring, COP tracking and wireless water-treatment telemetry.
Read the full story →
Smart marine telemetry
Edge protocol decoding, LoRaWAN mesh sensing and store-and-forward at sea.
Read the full story →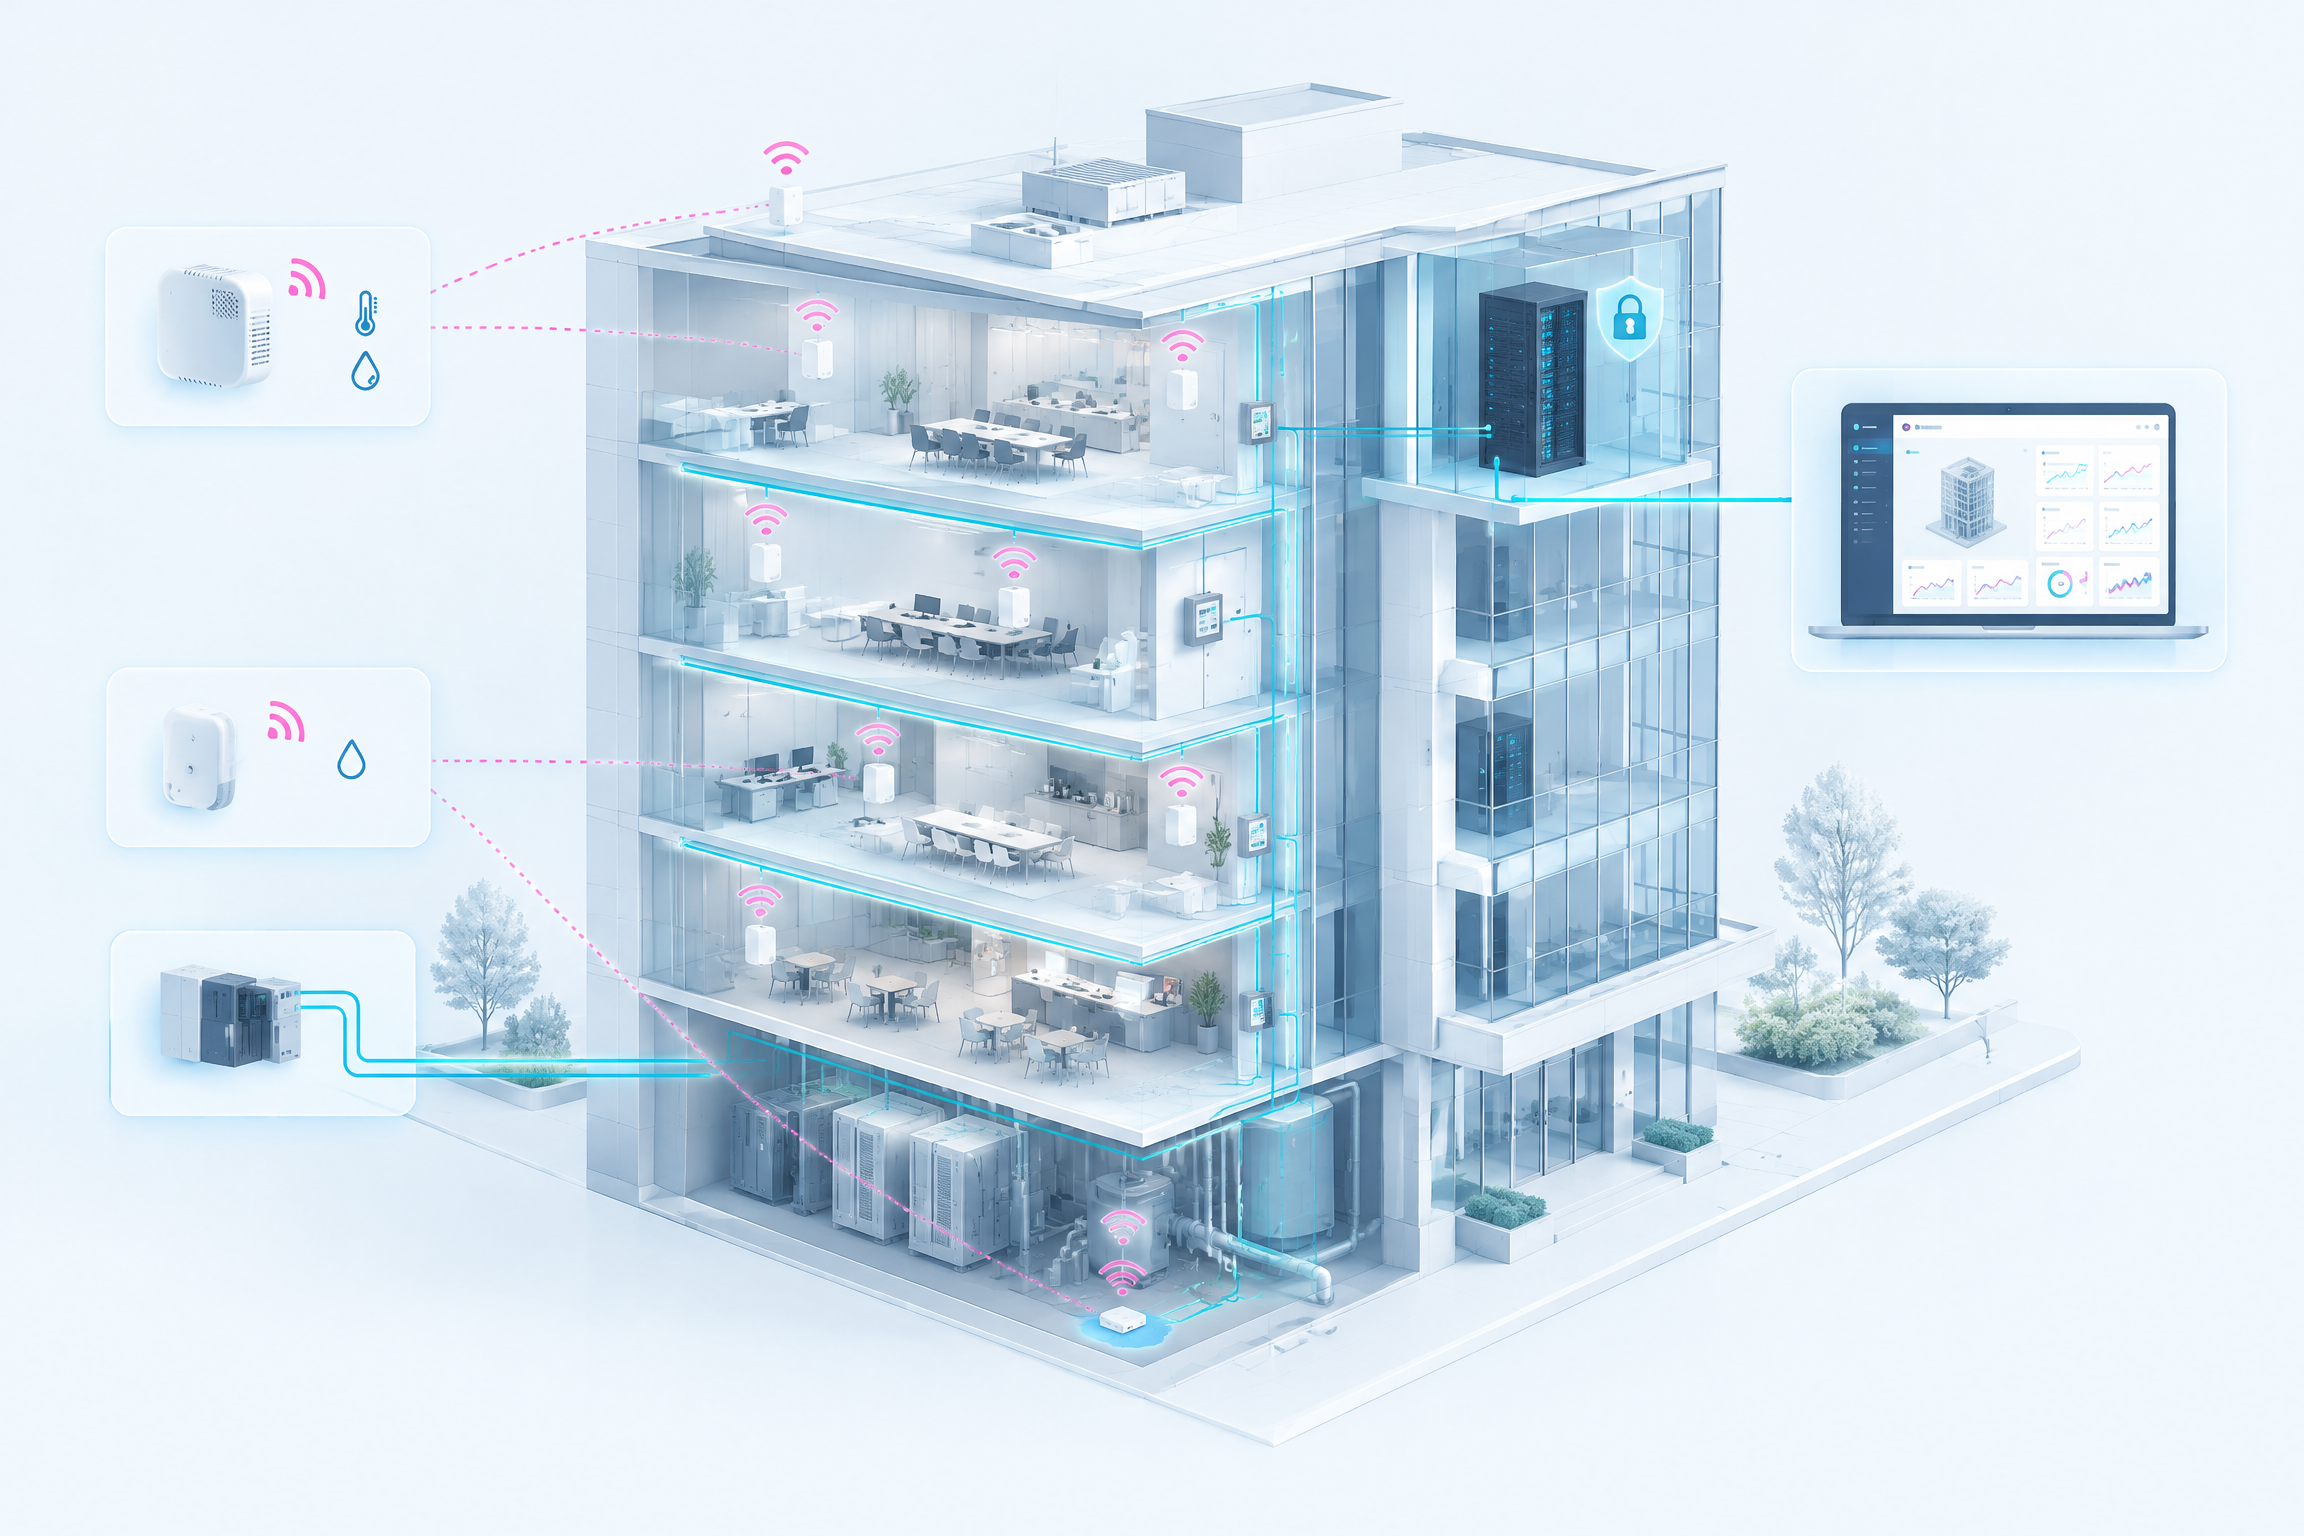
TNB Energy Services
On-premises BMS modernisation connecting BACnet and LoRaWAN.
Read the full story →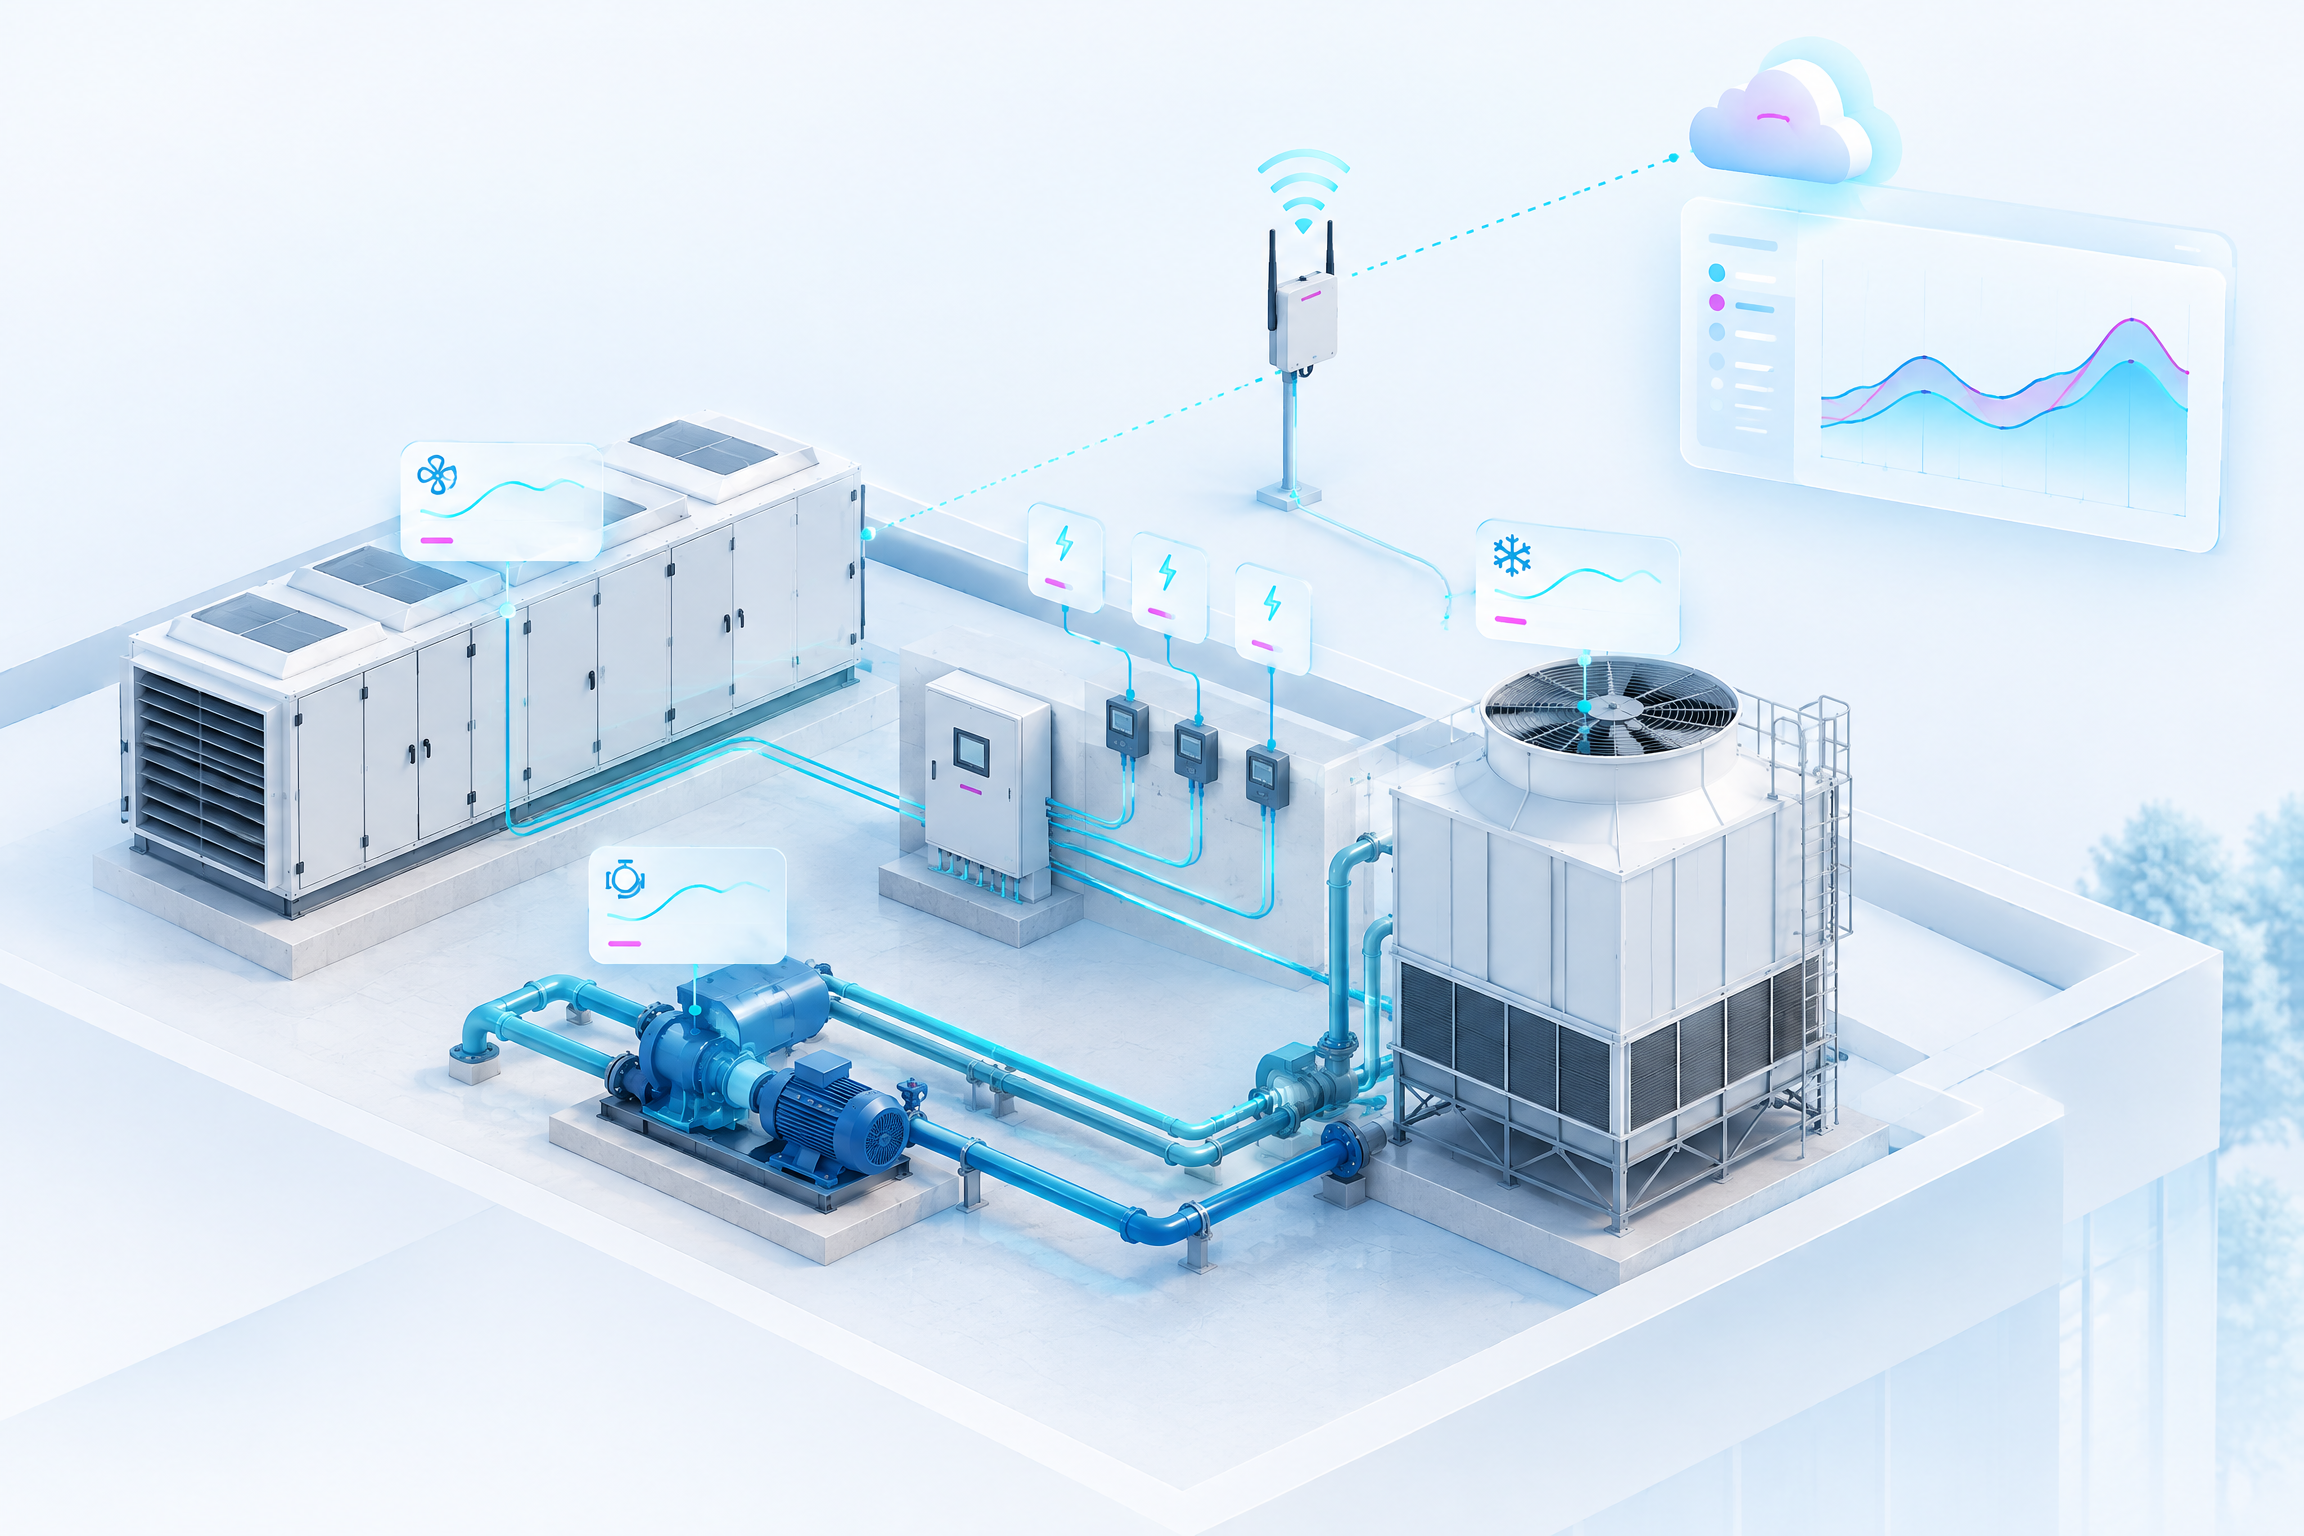
Supergreen Planet DCD
Verified HVAC energy visibility, remote control and multi-site reporting.
Read the full story →Next step
Book a site assessment
Tell us the building type, floor area, what systems are already installed, and what you need to solve. We will come back with an assessment.
Book a site assessment