
Compliance dashboards and reports
Dashboards and reports built around your KPIs — or the reporting your regulator requires.
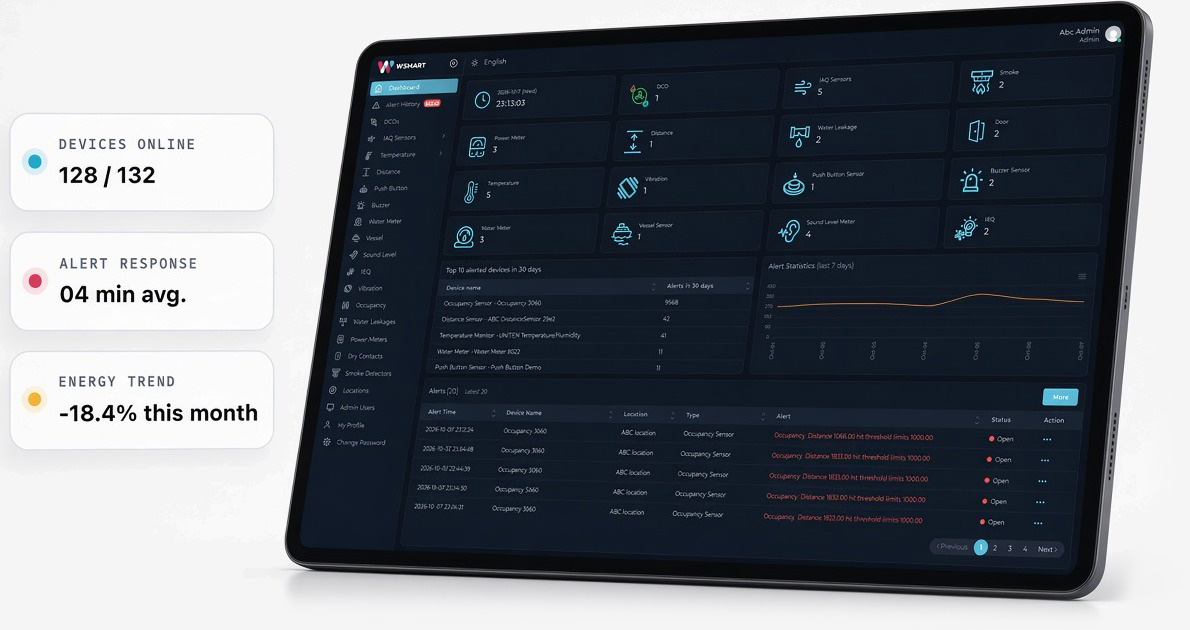
What the dashboard has to carry
Reporting where your management team already looks
Live device health
A live view of the whole device fleet — so an offline sensor shows up before it becomes a gap in the record.
Consumption by floor, tenant or circuit
Electricity and water figures per floor, tenant or circuit — so leaks and high-usage areas show up instead of disappearing into averages.
Temperature and humidity by zone
Environmental trends that let you judge whether an air-handling unit is performing or drifting.
Occupancy by zone
Headcount, peak hours and utilisation rates, which is what justifies staffing and space decisions.
Alarms and the event log
Every alarm, and every user action taken against it, logged with a timestamp and the person responsible.
Cost and carbon after a project
Before-and-after energy, carbon and cost performance for an efficiency measure, calculated on your own readings.
Reporting output
Built around your KPIs — or the reporting your regulator requires
Views, reports and formulas tailored to your KPIs — not a one-size template.
Energy, carbon and cost-savings calculations where a project has to be justified after the fact.
Reporting output aligned to regulatory submission formats.
ESG and compliance reporting from the same data the operations team already uses.
Trend analysis and forecasting by need and timeframe.
Reports available on desktop, tablet and mobile, so a figure can be checked on site rather than back at a desk.
If you do not yet have monitoring, start with cloud monitoring — dashboards come second. A report is only as granular as the metering underneath it.
Next step
Book a site assessment
Tell us the building type, floor area, what systems are already installed, and what you need to solve. We will come back with an assessment.
Book a site assessment